In machine learning, we are often in the realm of “function approximation”. That is, we have a certain ground-truth (y) and associated variables (X) and our aim is to use identify a function to wrap our variables in that does a good job in approximating the ground-truth. This exercise in function approximation is also known as “supervised-learning”.
“Unsupervised learning” on the other hand is a slightly different problem to tackle. Here, our data does not consist of a ground-truth. All we have is our variables. Let’s elaborate on how this situation is different from supervised learning.
Since we do not have a ground-truth, our task here is not to predict or approximate any outcome. Consequently, there is no loss/cost function providing feedback on how close or far our function’s output is to the ground-truth. Isn’t this perplexing? If there is no feedback on the “goodness” of our output, then how do we know if our output is desirable, or complete hogwash?
In this tutorial, we will look at what actually is unsupervised learning and comprehensively understanding and execute a common unsupervised learning task, clustering.
Clustering
In the absence of a teacher/ground-truth, what can we do with just out variables? Let’s take an example with the Online Retail Dataset. This is a dataset which contains all the transactions occurring between 2010-2011 for a UK-based online retailer. Let’s take a peek at the data using pandas.
Online Retail Dataset
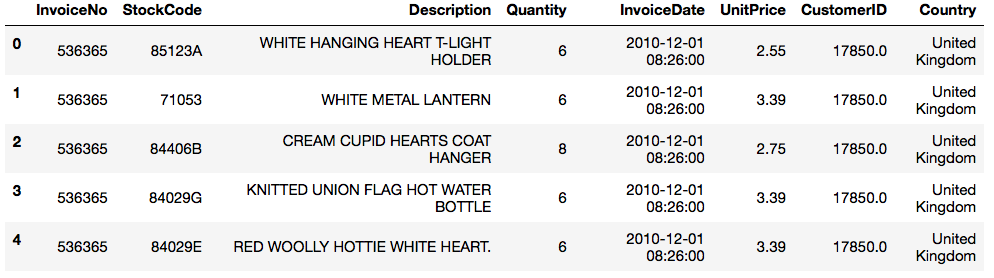 This dataset has 8 columns and more than 500,000 rows.
Now, imagine you work for this Online-retailer. What can be done with this data? Well, one activity could be to try and identify customer-types; how many different customer types do I get? This is a common task for e-commerce companies known as customer-segmentation. Customer segmentation is the practice of dividing a customer base into groups of individuals that are similar in specific ways relevant to marketing, such as age, gender, interests and spending habits. So, the purpose here it to identify customers that are similar to each-other, placing them in one group and then seeking other such groups or segments.
In machine learning, this task of identifying similarity is known as clustering. The most popular clustering technique used in “K-Means”
K-Means Algorithm
K-Means is an iterative clustering algorithm that seeks to cluster homogeneous or similar subgroups in our data. The first thing we need, then, is to explicitly define similarity/dissimilarity.
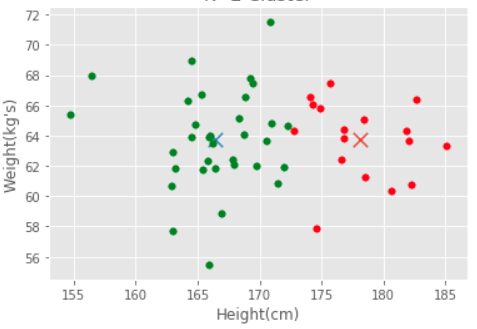
Similarity amongst our observations, in the simplest terms, can be stated via Euclidean distance between data points. Let's illustrate this with the example below of a plot of individuals by their height and weight, clearly green data points (individuals) are more similar to each other than to the red data points.
Simple Example of Similarity: Heights and Weights
So, if two data points are similar, we will consider them as part of one cluster. Ideally, we would want data points in one cluster to be as close to each other. We then can state the goal of clustering formally: to minimize the distance between observations within one cluster, across all clusters. Let's express this via a function.
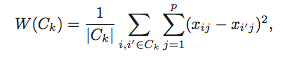
The inner-part of the function W(Ck), Σ(xij-xi’j) reads, “Within cluster variation is the squared sum of Euclidean distance between observations in the Kth cluster”. The outer Σ is only summing up the euclidean distance across clusters (1 through K clusters, hence the name K-means!).
Our goal then is to minimize the function W(Ck). Ok, but how? The iterative algorithm (steps) to accomplish this minimization are:
- Randomly assign a number between 1 and K ( we will get to how to choose this later) to each row in your data. This is the initial cluster assignment.
- For each cluster, compute the cluster centroid. The centroid is simply a vector of feature mans for observations in each of the K clusters. The size of this vector depends on the numbers of features (p) in the dataset. For the Online Retail, this would be 8.
- Revisit the initial cluster assignment and re-assign each row to the cluster whose centroid’s pth feature mean is closest to it.
- Iterate (repeat steps 1-3) until cluster assignment stops changing or is within a tolerable level (more on this later)
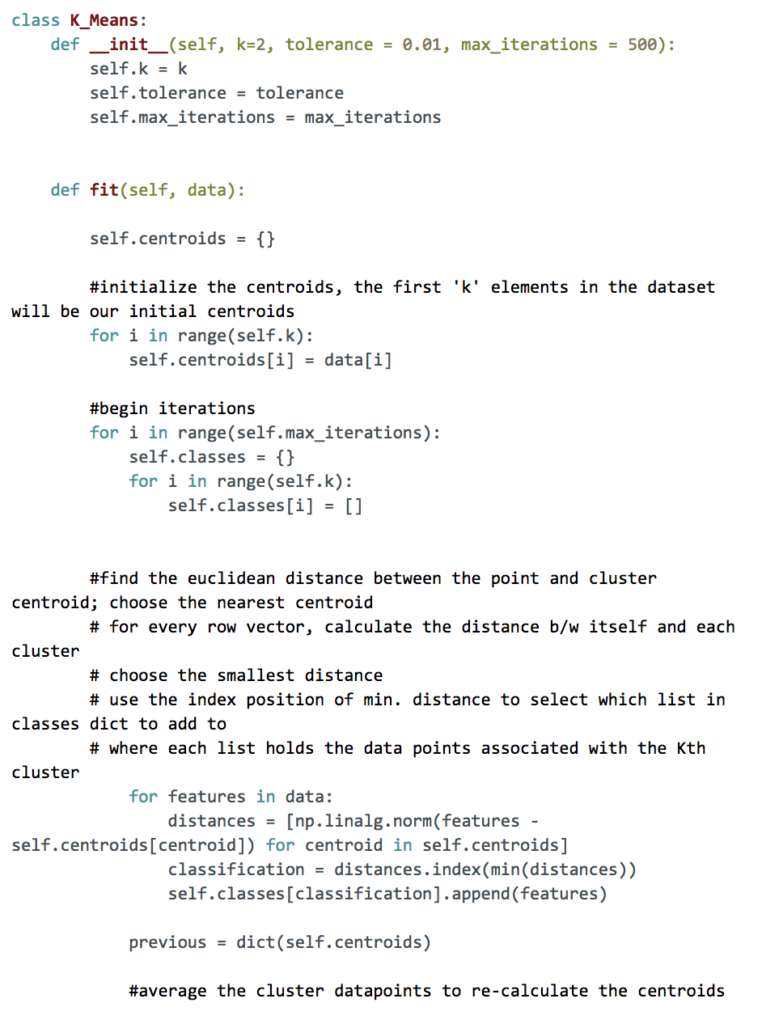
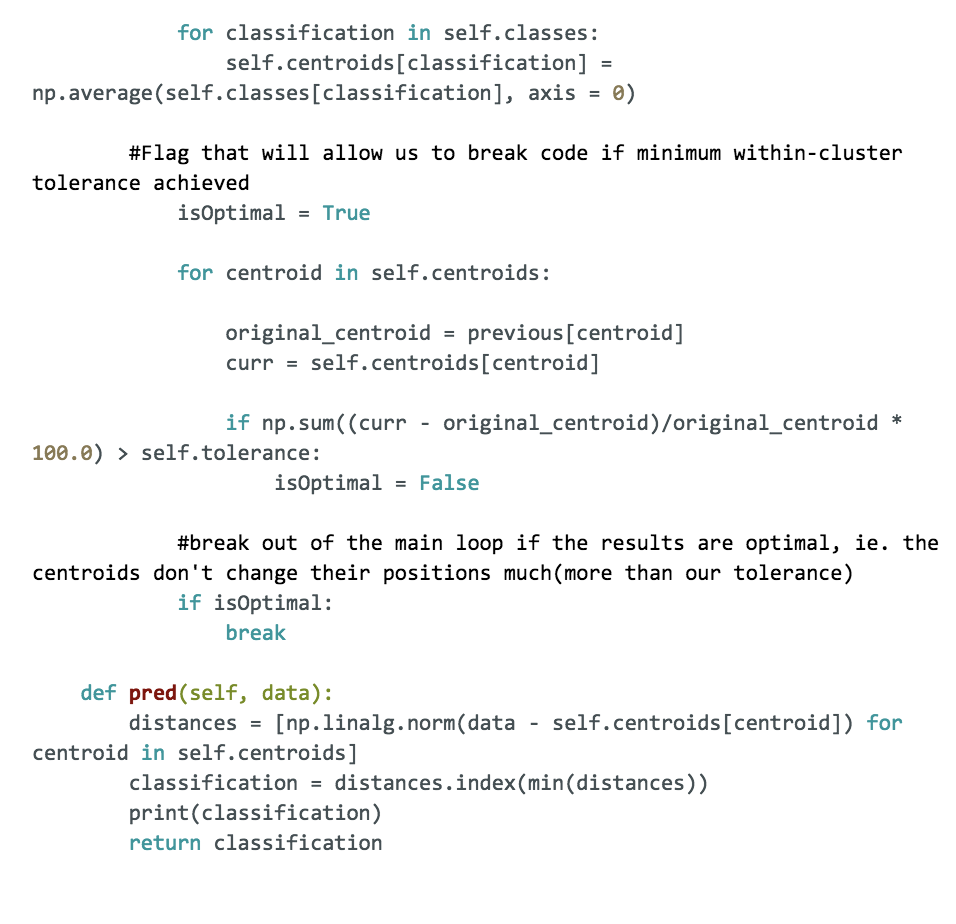
The class K-means below is an implementation of the above steps. Reading through the comments will help you understand the steps.
In the Online Retail dataset, if we divide our customers into only 2 segments and send out marketing material to each customer as per their cluster assignment, we may have too general of a marketing pitch. Thereby, customers may not return to our e-commerce website. On the other hand, if we divide our customers into 100 segments, we may only have a handful of customers per segment and it will be a nightmare to send out 100 variations of marketing material. So, while the choice of K is a business decision we do have techniques to guide our final decision. There are a few things left to explain before we apply the algorithm to our data. First, how do we choose how many clusters we want in our data? Well, this is exactly at the heart of the clustering problem. We do not know if there are 4 types of customers (clusters) as per our data, or 7 since this is indeed an unsupervised problem. So, part of our task is to identify the most suitable number of K clusters to segment our data. However, there is no “correct” answer here since there is no ground-truth. Indeed, choosing the value of K is often a business decision.
Choosing the “right” K
Elbow Method
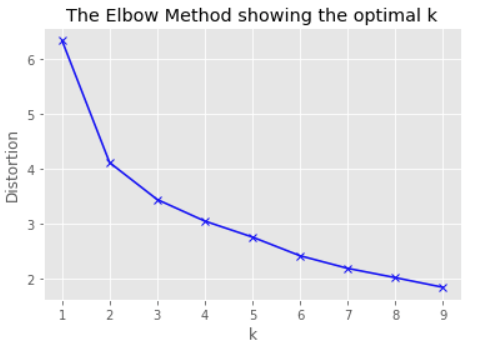
The elbow method allows us to make a decision on a value of K via visual aid. We try breaking up our data into a different number of K clusters and plot each K cluster-type against the corresponding W(Ck). An example is below.
We choose the value of K at the position when the decrease in the W(Ck) for values of K begins increasing. So, for the example below, the optimal K appears to be 2 since the decrease in W(Ck) between K = 1 and K=2 is larger then drop in K = 3 and K =2. So, we visually look for the “elbow” of the curve.
Silhouette Method/Analysis
Silhouette analysis can be used to study the separation distance between the resulting clusters. The silhouette coefficient displays a measure of how close each point in one cluster is to points in the neighboring clusters and thus provides a way to assess parameters like the number of clusters. This measure has a range of [-1, 1].
Silhouette coefficients (as these values are referred to as) near +1 indicate that the sample is far away from the neighboring clusters. A value of 0 indicates that the sample is on or very close to the decision boundary between two neighboring clusters and negative values indicate that those samples might have been assigned to the wrong cluster.
The Silhouette Coefficient is calculated using the mean within-cluster distance/variation (a) and the mean nearest-cluster distance (b) for each sample. The Silhouette Coefficient for a sample is (b - a) / max(a, b). To clarify, b is the distance between a sample and the nearest cluster that the sample is not a part of
There is a visual component to plot the silhouette's you can follow at: http://scikit-learn.org/stable/auto_examples/cluster/plot_kmeans_silhouette_analysis.html
Conclusion
Clustering is challenging in that at the outset, one is not exactly sure whether the output is going to be useful. If one was to create 3 clusters or 8 clusters with a dataset, how do we know which one is the correct choice? Let us say using the Online Retail Dataset, one concluded that there are 6 customer-types or clusters. Based on this, the marketing department of the company sent out email advertisements to customers as per their cluster assignment. A clustering would be useful, say if customer interested in deals in electronic products actually received an email with those products. He or she would hopefully click on the advertisement and purchase an item.
Over-time, then one could evaluate the clustering based on the overall response of the customers on the email advertisements. Many clicks or purchases would reflect an appropriate clustering. If not, however, clearly the clustering needs to be adjusted.
This is exactly the challenge with clustering using K-means or any other method. While guides like the Elbow or Silhouette method exist, we can never be exactly sure of the validity of our clustering. Even so, K-means is a powerful and quick algorithm that if used wisely in conjunction with domain knowledge, can produce great results.
Liked what you read? Checkout Byte Academy's Data Science Immersive and Intro courses.